Italy SDG
Infographic
Italy SDG
Infographic
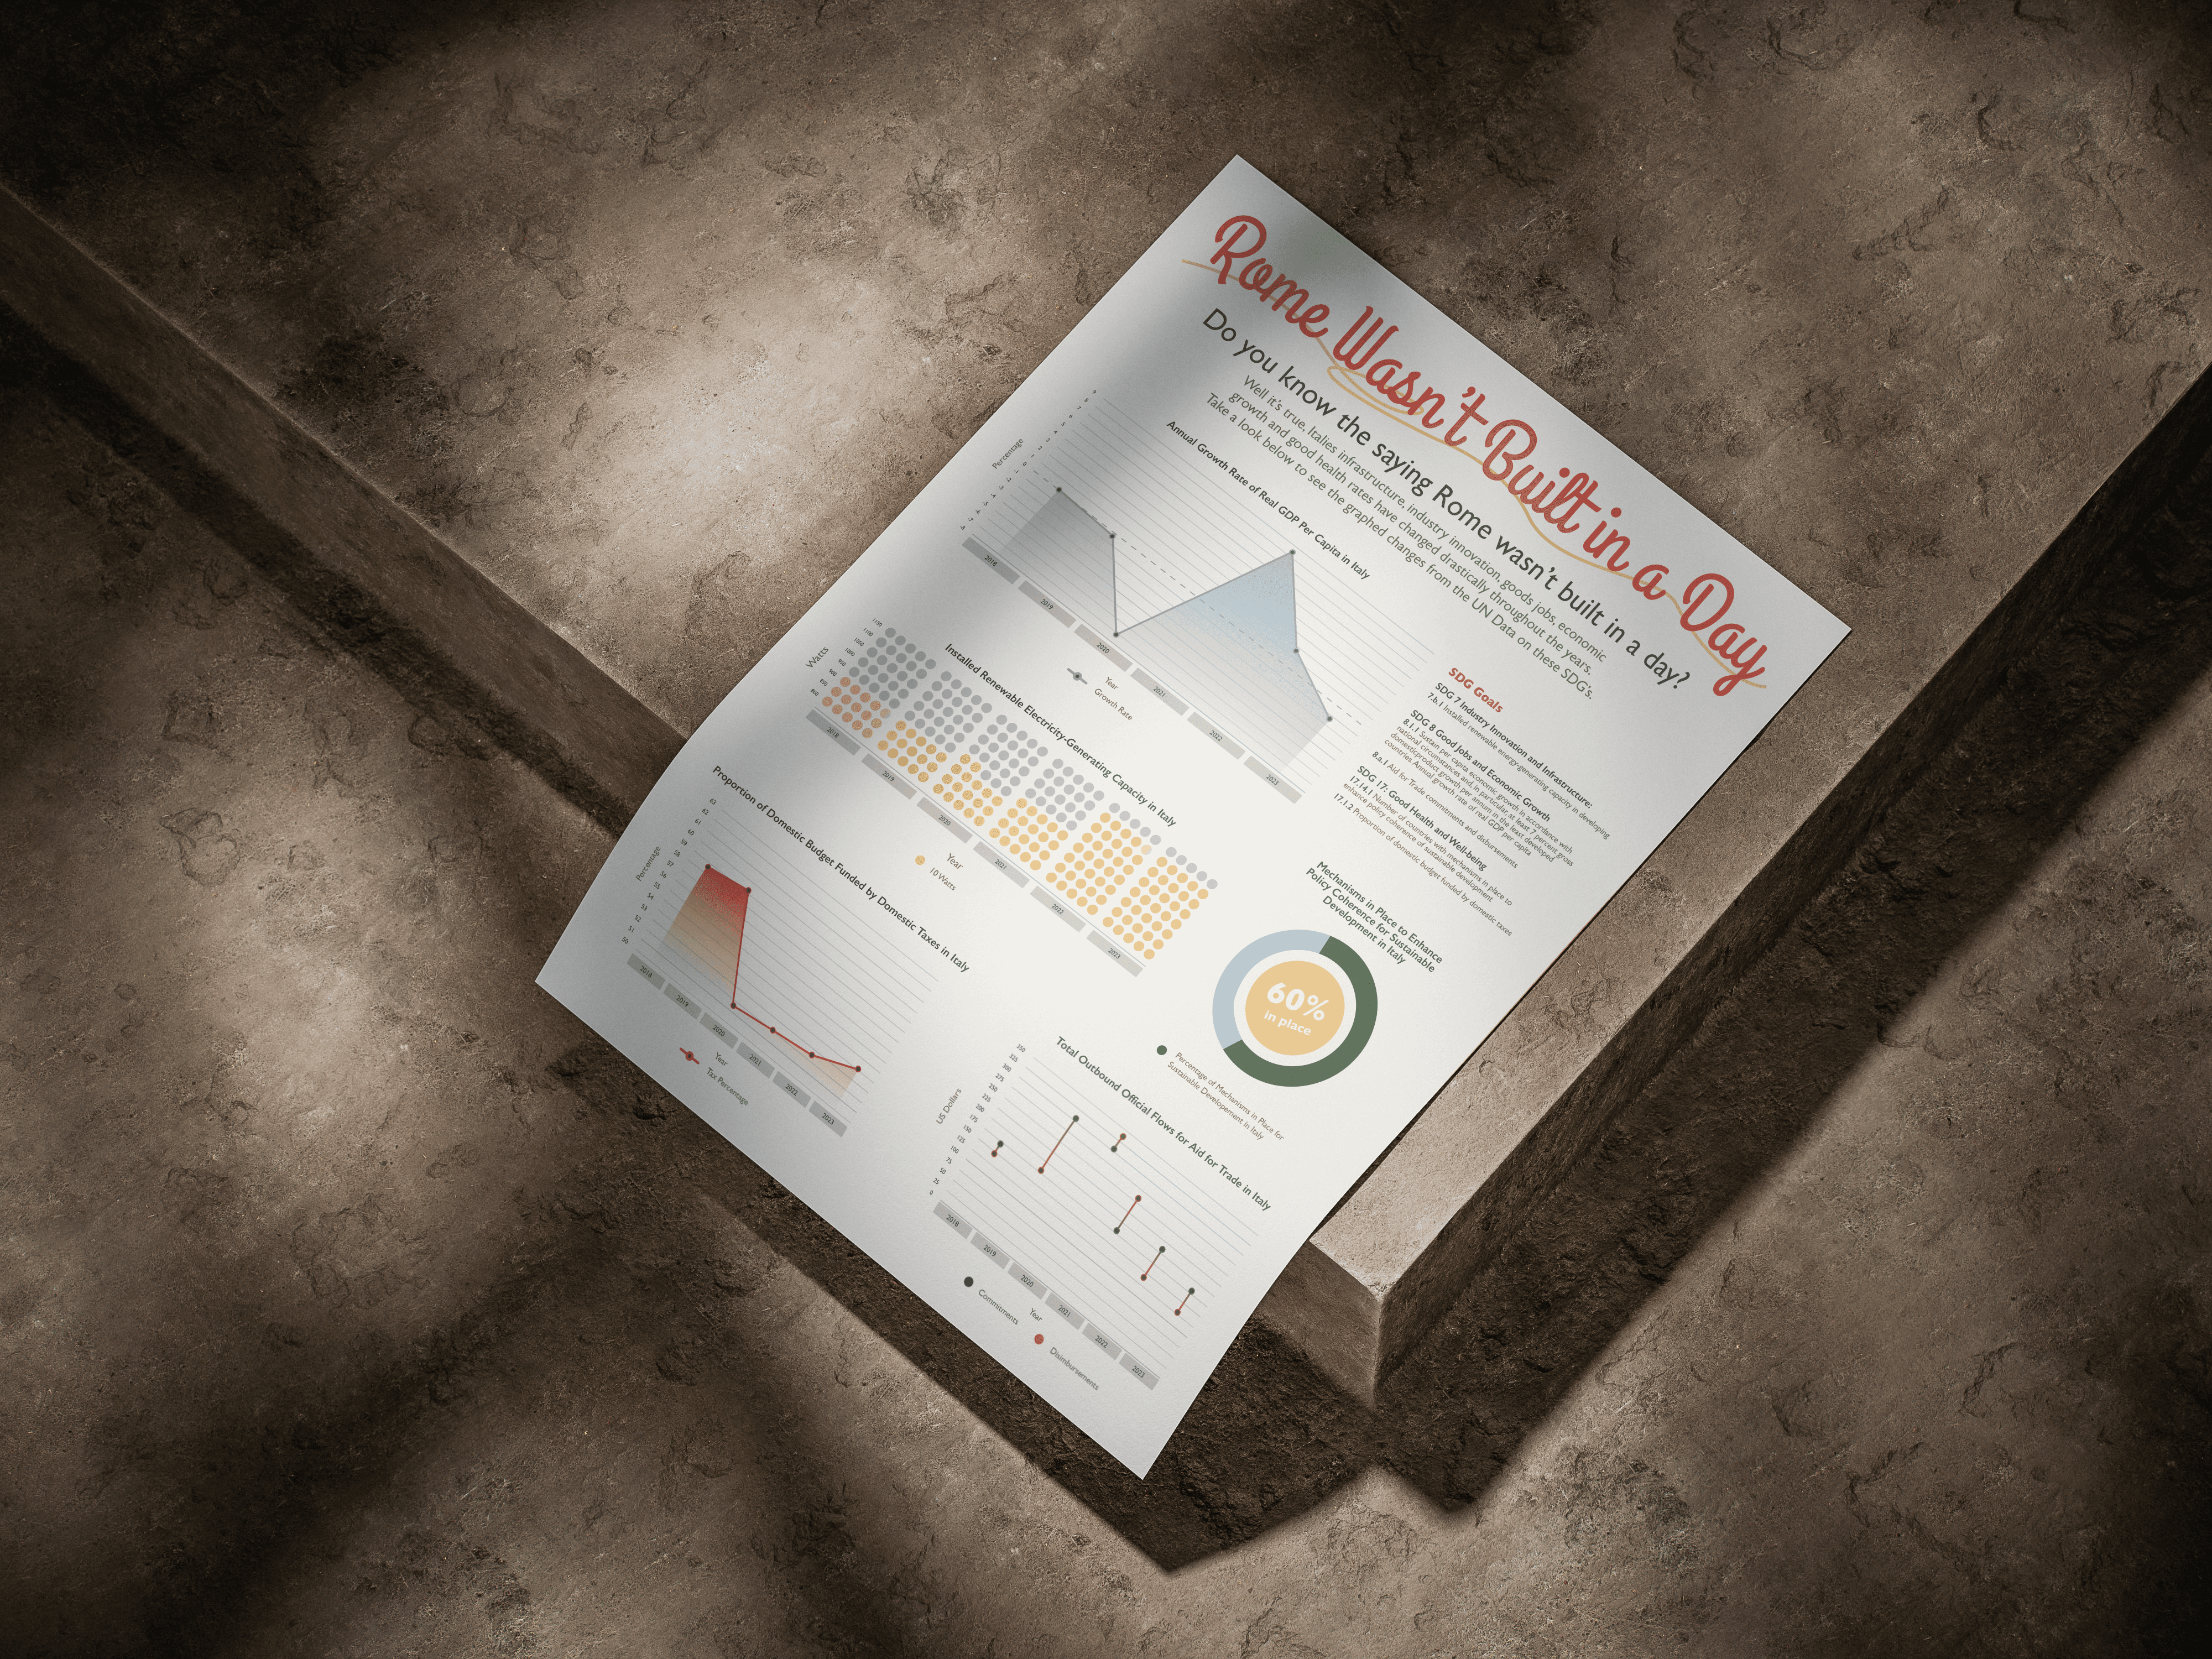
The United Nations established the Sustainable Development Goals (SDGs) in 2015, adopted by all UN member states as a shared roadmap toward a more sustainable future. This poster visualizes Italy's progress from 2018–2023 across three SDG targets, tracking the country's growth, setbacks, and recovery, because Rome wasn't built in a day.
The United Nations established the Sustainable Development Goals (SDGs) in 2015, adopted by all UN member states as a shared roadmap toward a more sustainable future. This poster visualizes Italy's progress from 2018–2023 across three SDG targets, tracking the country's growth, setbacks, and recovery, because Rome wasn't built in a day.
The United Nations established the Sustainable Development Goals (SDGs) in 2015, adopted by all UN member states as a shared roadmap toward a more sustainable future. This poster visualizes Italy's progress from 2018–2023 across three SDG targets, tracking the country's growth, setbacks, and recovery, because Rome wasn't built in a day.

Breaking Down the Data
Breaking Down the Data
The infographic pulls together data across four key indicators to tell Italy's SDG story: annual GDP growth per capita, installed renewable electricity-generating capacity, the share of the domestic budget funded by domestic taxes, and total outbound aid and trade flows. Together, these charts reveal a country steadily building toward its sustainability goals, with progress that, much like Rome itself, took time, setbacks, and steady effort to achieve.
The infographic pulls together data across four key indicators to tell Italy's SDG story: annual GDP growth per capita, installed renewable electricity-generating capacity, the share of the domestic budget funded by domestic taxes, and total outbound aid and trade flows. Together, these charts reveal a country steadily building toward its sustainability goals, with progress that, much like Rome itself, took time, setbacks, and steady effort to achieve.
